Statnews.com is a site that tries to create an aura of a serious, respectable science news site. It bills itself as "your go-to source for the world of life sciences, medicine, and biopharma." My guess is that the site gets funding from pharmaceutical companies and medical device manufacturers, and that it exists largely to serve their interests. On the site's pages we don't get the usual swarm of ads that you see these days on so-called science news site; but there are some ads. You should always be suspicious of any science news site containing ads. Every time you see an ad on the pages of Statnews.com, you should remember that online science news sites containing ads will tend to have clickbait headlines that drive people to click on headlines, so that they go see ads that make the site owners money.
At a recent article at statnews.com we have an example of someone making a misleading statement. We have a biologist who boasts "I’ve published more than 340 papers that have garnered more than 100,000 citations." But the biologist was merely a co-author of most of such papers, which typically had 5, 10 or as many as 39 authors each. It is not right to create the impression that you did by yourself some writing that actually required the work of hundreds of different authors in addition to yourself.
Recently at the site we saw this headline: "Baylor crowned STAT Madness champion for second consecutive year, for insights into memory." This is followed by the utterly untrue claim that "researchers showed brain cells called astrocytes are involved in forming and recalling memories."
We read of something called the 2025 STAT Madness competition, "a bracket style celebration of neuroscience research." We read of some voting process, although we get no details of how this worked. We read the claim that the competition "stacked 64 entries against each other in a month long combination." Sadly the winner of this competition was a very low-quality piece of junk science entitled "Learning-associated astrocyte ensembles regulate memory recall." You can read the abstract here.
The paper is behind a paywall. Why has the Statnews.com site given an award for a study that the public cannot even access? But without paying any money, I can use the abstract link to get all the information I need to determine that the study is junk science. For the abstract link does allow me to look at some of the paper's figures And those figures tell me enough to determine the junk science nature of the paper.
Figure 1 is below, and it has two "freezing percentage" bar graphs at its bottom.
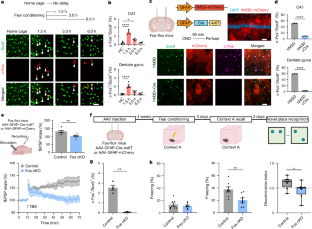

Figure 4 and Figure 5 look similar. Figure 4 (entitled "Reactivation of LAAs elicits memory recall") has three "freezing percentage" bar graphs. Figure 5 (entitled "Ensemble-specific NFIA is necessary for context-specific memory") has two "freezing percentage" bar graphs.
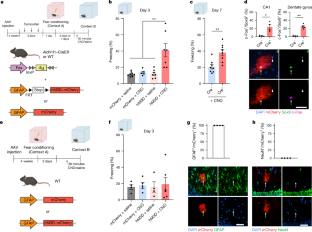
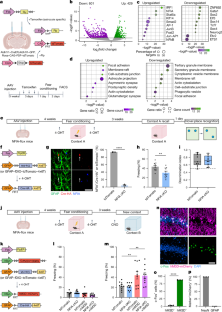
From these figures, I can tell that the paper is guilty of two of the methodological sins so very common in memory-related rodent research, either one of which is enough to show the paper is very low-quality research.
Fault 1: Judgments of Freezing Behavior Were Used to Try to Judge Animal Recall
We can tell from the figures mentioned above that the researchers attempted to measure recall in a rodent by using a "freezing behavior" estimation. All rodent experiments that use such a method are examples of junk science. The technique involves putting a rodent in a cage in which there is some stimulus the animal was trained to fear, and then trying to judge fear or recall by trying to judge what fraction of a time interval the rodent was immobile, with the immobility being judged as the rodent "frozen in fear." Neither fear nor memory nor recall can reliably be measured by such a technique. How often a rodent is immobile in a cage is a random thing that does not reliably correlate with how much the rodent is afraid or how often the rodent recalls a fearful stimulus. For a full discussion of the utter unreliability of "freezing behavior" judgments in neuroscience experiments, see my long post here, entitled "All Papers Relying on Rodent 'Freezing Behavior' Estimations Are Junk Science."

Fault 2:Way-Too-Small Study Group Sizes
The use of way-too-small study group sizes is more the rule than the exception in today's neuroscience rodent research.
Research design/method | Minimum sample size suggestion |
Correlational | 64 participants for one-tailed hypotheses; 82 participants for two-tailed hypotheses (Onwuegbuzie et al ., 2004) |
Causal-comparative | 51 participants per group for one-tailed hypotheses; 64 participants for two-tailed hypotheses (Onwuegbuzie et al., 2004) |
Experimental | 21 participants per group for one-tailed hypotheses (Onwuegbuzie et al., 2004) |
Phenomenological | <= 5/10 interviews (Creswell, 1998); >= 6 (Morse, 1994 |
“For correlational, causal-comparative and experimental research designs, the recommended sample sizes represent those needed to detect a medium (using Cohen’s [1988] criteria), one-tailed statistically significant relationship or difference with 0.80 power at the 5% level of significance.” | |
Source: “Prevalence of Mixed-methods Sampling Designs in Social Science Research” by Kathleen M.T. Collins, Anthony J. Onwuegbuzie and Qun G. Jiao. | |

I can give an example of how you could do work similar to the utterly shoddy work that was awarded the STAT prize. You might do a project trying to show that some people can predict which cards are at the top of a newly shuffled deck that has been cut.
A very important of your work would be to not publish beforehand any exact plan for how the research would be done. Then you could do some tests that would work line this:
(1) You shuffle a deck of cards three times, and then cut the deck.
(2) You bring in someone, asking him to guess the first ten cards that you will draw from the top of the deck.
You could have a "Correct Guesses" sheet recording the drawn result and the guess result for each of the guesses. Now, it would help very much if you used a technique that did not reliably record the guesses the guesser made. It might work like this: you could ask the user to list a sequence of ten guesses. You would then deal the first ten cards out on the table. You would then record your best recollection of the sequence of ten cards that the user had called out.
This would not be a reliable measurement technique, because you had failed to write down each guess just after the guesser made it. So you would now be relying on your memory of the sequence of 10 cards the user chose. You could easily bias things by failing to remember correctly one or more of the cards the guesser had stated. This would help you get a more favorable "correct guesses" total.
Now doing such a test on a few subjects, you would have some data: the sequence of ten cards drawn, and what the ten guesses made were (or at least, your best guess about what those guesses were, based on your short-term memory). You would then have a variety of ways to analyze your data. You could use the entire sequences of ten guesses. Or if you did not like the "percentage correct" result from that, you could use only the first five cards guesses. Or if you did not like the "percentage correct" result from that, you could use only the last five cards guessed. Or if you did not like the "percentage correct" result from that, you could use only the middle five cards guessed.
Or, if you were not getting anywhere trying to show above-chance card guessing, you could only report correct guesses of the card number or card face. Or, if you still were not getting anywhere trying to show correct card guessing, you could only report correct guesses of the card suit (clubs, spades, hearts or diamonds). Or, if you still were not getting anywhere trying to show correct card guessing, you could only report correct guesses of the card color (black or red). Or if the entire set of data showed no effect above chance for the card guessing, you could report on only an above-chance result for a single guesser.
What happened if you tried all these things for 5 subjects, and were still unable to find anything greater than chance? No problem. You could simply "file drawer" the results, filing them away in your files. You could then start a new experiment using a different set of 5 subjects. After a few such attempts, you would probably have something you could report as an "above chance" result for card guessing, given your small study group sizes, and given your freedom to analyze the data in any of dozens of different ways. False alarms tend to show up with small data sets. Most of those false alarms go away when you use a much larger study group size.
For example, if you flip a coin 100 times you will get a number of heads very close to 50. But if you flip a coin only a small number of times, it is very easy to get a result much different from the result expected by chance. So, for example, it is not too hard to flip a coin six times and get four or more heads or four or more tails rather than the chance-expected result of three heads. The chance of such a result is greater than 33%. Do three trials of six flips each, and you will probably get one trial with four heads or four tails.
The example given above is very much like the typical neuroscience rodent experiment. Just like the card-guessing experiment I described, a typical neuroscience experiment fails to publish in advance any detailed research plan, leaving the experimenters free to analyze data in any of innumerable ways. For example, there are no standards for how to judge "freezing behavior" in rodents. So an experimenter can attempt to judge how much a rodent was immobile after being exposed to some fear stimulus it was trained to fear, recording three minutes of data. If the experimenter does not like the "freezing percentage" recorded for the first three minutes, the experimenter can simply report on only the "freezing percentage" recorded for the first two minutes. If the experimenter does not like the "freezing percentage" recorded for the first two minutes, the experimenter can simply report on only the "freezing percentage" recorded for the first 60 seconds. If the experimenter does not like the "freezing percentage" recorded for the first 60 seconds, the experimenter can simply report on only the "freezing percentage" recorded for the first 30 seconds. Since there is no convention of a standard time interval to use, and since researchers typically get away without even reporting what was the time interval corresponding to a "freezing percentage" graph, it is easy for a researcher to switch around the time interval in any way he wants, and not even use the same time interval for each freezing percentage" graph in his paper.
And just as the card-guessing experimenter I described used an unreliable technique for measuring a key element of the experiment (relying on the experimenter's memory of what 10 called guesses were), nowadays neuroscience rodent memory experiments rely on an utterly unreliable measurement technique: the technique of trying to judge an animal's recall by judging an animal's immobility during an arbitrary span of time, with that immobility called "freezing behavior." There are reliable ways of measuring whether a rodent recalled something. You can use heart-rate measurement to measure heart rate spikes, and that is a reliable way of telling whether a rodent is recalling a fearful stimulus (the heart rate of rodents spikes dramatically when they are afraid). Or you can use something like the Morris water maze, widely regarded as a reliable way of measuring how well a rat remembered something. Or you can use the Fear Stimulus Avoidance technique described below.

But if you use the unreliable "freezing behavior" technique, your paper deserves nothing but scorn. And the more "freezing behavior" graphs that your paper has, the more it deserves scorn and contempt.
Nowadays neuroscience memory research involving rodents tells us mainly one important thing about memory: that neuroscience rodent researchers seem to have memories so bad that they keep forgetting to follow good standards in doing research.


No comments:
Post a Comment