A
very interesting question relevant to the thesis of this site is
whether there are particular parts of the brain that are strongly
associated with particular facets of human mental functionality. Are
there, for example, regions of the brain that work much harder when
you learn something, or remember something, or feel something? The
idea that there are such areas is a hypothesis called localization.
If there is very strong
evidence for localization, this may support the idea that your brain
generates your mind; but if there is no such strong evidence, that
would tend to support the idea that your brain is not the source of
your mind.
Some
claim that this idea of localization is supported by brain imaging
studies. It is claimed that quite a few studies tell us about the
neural correlates of conscious experiences. In a typical study of
this type, people will have their brains scanned by some instrument
such as an MRI machine. Then scientists will look for certain parts
of the brain which showed more activity (such as blood flow) when
some particular type of mental activity was occurring.
But
there are reasons for thinking that such studies tell us very little.
For one thing, brain imaging studies on the neural correlates of
consciousness typically involve only small numbers of participants
(often fewer than 25). Making generalizations from such small samples
is dubious.
Also,
claims that particular regions of the brain show larger activity
during certain mental activities are typically not well-replicated in
followup studies. A book
by a cognitive scientist states this (page 174-175):
The
empirical literature on brain correlates of emotion is wildly
inconsistent, with every part of the brain showing some activity
correlated with some aspect of emotional behavior. Those experiments
that do report a few limited areas are usually in conflict with each
other....There is little consensus about what is the actual role of a
particular region. It is likely that the entire brain operates in a
coordinated fashion, complexly interconnected, so that much of the
research on individual components is misleading and inconclusive.
An article on neursosciencenews.com states the following:
Small sample sizes in studies using functional MRI to investigate brain connectivity and function are common in neuroscience, despite years of warnings that such studies likely lack sufficient statistical power. A new analysis reveals that task-based fMRI experiments involving typical sample sizes of about 30 participants are only modestly replicable. This means that independent efforts to repeat the experiments are as likely to challenge as to confirm the original results.
There
have been statistical critiques of brain imaging studies. One
critique found a common statistical error that “inflates
correlations.” The paper
stated, “The underlying problems described here appear to be common
in fMRI research of many kinds—not just in studies of emotion,
personality, and social cognition.”
Another
critique
of neuroimaging found a “double dipping” statistical error that
was very common. New
Scientist
reported a software problem, saying
“Thousands of fMRI brain studies in doubt due to software flaws.”
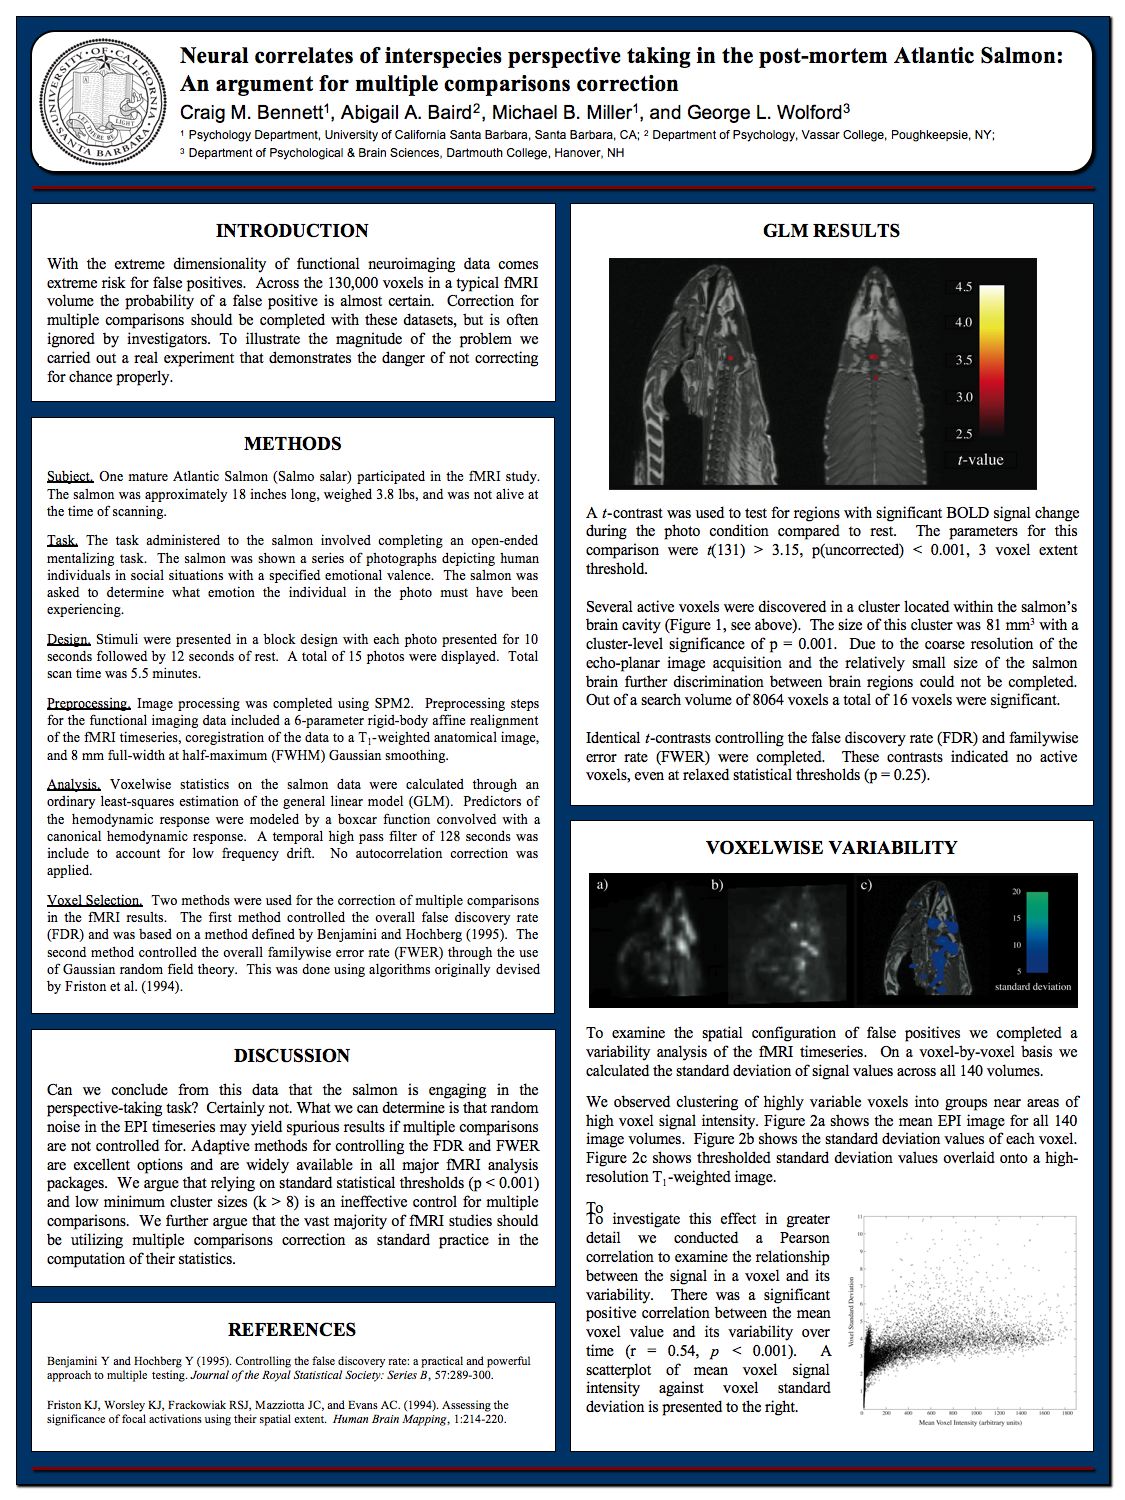
Flaws in brain imaging studies were highlighted by a study that found "correlations of consciousness" by using an fMRI brain scan on a dead salmon. See here for an image summarizing the study. The dead salmon study highlighted a problem called the multiple comparisons problem. This is the problem that the more comparisons you make between some region of the brain and an average, the more likely you will be to find a false positive, simply because of chance variations. A typical brain scan study will make many such comparisons, and in such a study there is a high chance of false positives.
Flaws in brain imaging studies were highlighted by a study that found "correlations of consciousness" by using an fMRI brain scan on a dead salmon. See here for an image summarizing the study. The dead salmon study highlighted a problem called the multiple comparisons problem. This is the problem that the more comparisons you make between some region of the brain and an average, the more likely you will be to find a false positive, simply because of chance variations. A typical brain scan study will make many such comparisons, and in such a study there is a high chance of false positives.
Considering
the question of “How Much of the Neuroimaging Literature Should We
Discard?” a PhD and lab director states,
“Personally I’d say I don’t really believe about 95% of what
gets published...I think claims of 'selective' activation are almost
without exception completely baseless ” This link says that a study, "published open-access in the Proceedings
of the National Academy of Sciences,
suggests that the methods used in fMRI research can create the
illusion of brain activity where there is none—up to 70% of the
time."
Instead of it being the case that only some particular parts of the brain activate when a certain task is performed, it is instead true that if you keep taking brain scans of the same task being performed, you will see almost all regions of the brain activate. As one scientific study concludes, "fMRI activations extend well beyond areas of primary relationship to the task; and blood-oxygen level-dependent signal changes correlated with task-timing appear in over 95% of the brain for a simple visual stimulation plus attention control task."
Another
huge reason for being skeptical about brain imaging studies is that
such studies very often use very misleading visual presentations,
creating false impressions. What very frequently goes on is something
like this. A series of brain scans will show a very small difference
between brain activity in different parts of the brain – typically
only 1%. A Stanford scientific paper
on fMRI uses this 1% figure, making an exception only for small parts
of the brain (“visual and auditory cortices”) associated with
seeing and hearing. The paper makes this generalization: “While
cognitive effects give signal changes on the order of 1% (and larger
in the visual and auditory cortices), signal variations of over 10%
may arise from motion and other artifacts in the data.” In other
words, people moving their heads (and other misleading signals) may
create the impression that there is a higher variation in the
non-sensory parts of the brain, but the real variation in the signal
changes is only something like 1%. A similar generalization is made
in this
scientific discussion, where we are told the following:
For example, most cognitive experiments should show maximal contrasts of about 1% (except in visual cortex), hence, if estimates for a single subject are much larger than that, then the estimates are likely to be bad. Poor estimates can arise from head motion, or sporadic breathing patterns by the subject, or sometimes from a poor design matrix that is ill-conditioned.
And again on this technical message board, a brain scan analyst tells us the following:
At a group level, I believe that average percent signal change extracted from an fMRI analysis would be reasonable if < 1%. Usually, I actually see values on average < 0.5% or even lower.
But
again and again studies on neural correlations will produce a visual
which grossly exaggerates this very small difference of 1% or less, making it
look like a great big difference. This is lying
with colors.
To
explain why this is highly deceptive, let's consider some examples of
displaying visual information: an honest presentation and a
misleading presentation. Imagine you have a home for sale, and you
are preparing a web page or brochure that describes your house's
selling points. One of the key factors in selling houses is the
quality of the local school district. Anyone with children will want
to buy a house in a neighborhood with better schools.
Imagine
you've got the average school stores for your home's school district,
and the data looks like this:
| District | Average Reading Score |
| District 1 | 80 |
| District 2 | 80 |
| District 3 | 80 |
| District 4 (yours) | 81 |
| District 5 | 80 |
| District 6 | 80 |
| District 7 | 80 |
| District 8 | 80 |
Now
imagine you wanted to present a school district map highlighting the
higher score of your home's school district. For you to honestly
present such information, you would have to follow this rule: the
difference in the color shade should be no different than the
differences in the data that you have.
So
if you were to present an honest school district map, color-coded
school scores, it would have to look something like this:

This
would be an honest map. It honestly indicates only a very slight
difference between the school scores in your home's school district
and the nearby districts. But you might be tempted to present the
data differently. You might present it like the map below.

This
map would be better from the standpoint of selling your house, since
it would leave someone with the impression that your house's school
district has much higher scores than the nearby districts. But given
the actual data showing only a 1% difference, it would be utterly
misleading to present a map like this. The map would incorrectly give
someone the idea that your home's school district had scores maybe
30% better than surrounding districts. Presenting a map like this
would be an example of lying
with colors.
It
is exactly such lying with colors that goes on again and again in
brain imaging studies on the neural correlates of consciousness.
Again and again, such studies will show visuals that depict
differences of only 1% or less between blood flow in different
regions of the brain. But such regions will be shown as red regions
in brain images, with all of the other areas having a grayish “black
and white” color. When you see such an image, you inevitably get
the impression that the highlighted part of the brain has much higher
activity than other regions. But such a conclusion is not what the
data is showing.
So,
for example, a study finding 1% higher brain activity in a region
near the corpus callosum (under some activity that we may call
Activity X) might release a very misleading image looking like the
image below, in which the area of 1% greater activity is colored in
red.

But
such an image is lying with colors. If there is only a 1% greater
activity in this region, an honest diagram would look like the one
below.

With
this diagram, the same region shown in red in the first diagram is
shown as only 1% darker. You can't actually tell by looking at the
diagram which region has the 1% greater activity when Activity X
occurs. But that's no problem. The diagram above leaves the reader
with the correct story: none of the brain regions differ in activity
by more than 1% when Activity X occurs. Contrast this with the first
image, which creates the very misleading idea that one part of the
brain is much more active than the others when Activity X occurs.
You
might complain that with such a visual, you cannot tell which regions
have the slightly greater activity. But there are various ways to
highlight particular regions of a brain visual, such as circling,
pointing arrows, outlining, and so forth. For example, the following
shows a region of high activity without misleading the viewer by
creating the impression of much higher activity:

The
misleading diagrams of brain imaging studies seem all the more
appalling when you consider that the images in such studies are
typically the only thing that laymen use to form an opinion about
localization in the brain. The text of brain imaging studies is
typically written in thick jargon that only a neuroscientist can
understand. Frustrated by this very hard-to-understand jargon and
unclear writing, every layman reading these studies forms his
opinions based on the visuals. When such visuals deceive us by lying
with colors (as they so often do), the whole study ends up being
something that has the effect of creating misleading ideas.
At
4:47 in this
online course, we are told that the blood changes in the brain are
quite small when observed with an MRI, between 0.1% and 5% (based on
two previous comments I quoted, the higher value seems to be only
found in the auditory cortex or the visual cortex). The speaker in
this course tells us that if we were to just watch a movie of the
fMRI scans, we
wouldn't be able to notice the changes
between different brain regions. But the visuals in neural
correlation studies misrepresent this minimal change, making it look
like a great big change. These cases of lying with colors give
readers a very misleading impression that brain activity involving
thinking and memory recall is very localized, and tightly correlated
with mental activity.
A review of the book "Reliability in Cognitive Neuroscience" by William R. Uttal states the following:
William Uttal warns against these claims, arguing that, despite its utility in anatomic and physiological applications, brain imaging research has not provided consistent evidence for correlation with cognition....This inconsistency of results, he argues, has profound implications for the field, suggesting that cognitive neuroscientists have not yet proven their interpretations of the relation between brain activity captured by macroscopic imaging techniques and cognitive processes; what may have appeared to be correlations may have only been illusions of association.
How
closely your brain is correlated with your mind is important from a
philosophical standpoint. If different parts of our brains surge
dramatically with blood when we think or recall memories, that is a
point favoring the idea that your mind is just a product of your
brain. But if different parts of your brain look pretty much the same
when you think or recall memories, that's a point in favor of the
idea that your mind and memories may involve something much more than
your brain, perhaps some soul or some higher cosmic consciousness
infrastructure. The actual data from brain imaging is the second of
these cases: different parts of the brain show about the same
activity when thinking or memory recall occurs. But by doing neural
correlation studies that visually make tiny changes look like huge
changes, our neuroscientists almost seem to be trying to fool us into
thinking that a very different thing is going on, that particular
parts of our brain light up dramatically when our higher mental
functions are engaged. To such neuroscientists we should say:
visually represent your own data honestly, and stop lying with
colors.
The paper here ("Suspiciously high correlations in brain imaging research") discusses at length very severe problems in brain imaging studies. It states the following on page 2:
"By 2008, this analysis error had become prevalent not only in neuroimaging studies of individual differences in emotion, personality, and social cognition (Vul et al. 2009a), but seemed to occur in many other guises (Vul & Kanwisher, 2010), and was estimated to have played some role in 40-50% of high profile fMRI papers regardless if their substantive focus (Kriegeskorte et al. 2009)."
Below this we see an interesting graph showing many studies with only about 12 subjects indicating a strong brain/behavior correlation, but few very studies showing such a strong correlation when 25 or more subjects were used.
On page 23 the paper states the following:
"With a plausible population correlation of 0.5, a 1000-voxel whole-brain analysis would require 83 subjects to achieve 80% power. A sample size of 83 is five times greater than the average used in the studies we surveyed: collecting this much data in an fMRI experiment is an enormous expense that is not attempted by any except a few major collaborative networks."
In other words, brain imaging studies tend to use only a fraction of the sample size they need, given the techniques they typically use. It's possible to do a reliable study with a small sample size, if you limit the analysis to only one small tiny area of the brain. But that is almost never done.
On page 33 the paper above states the following, giving us a strong reason for skepticism about brain scanning studies:
"In short, our exploration of power suggests that across-subject whole-brain correlation experiments are generally impractical: without adequate multiple comparisons correction they will have false positive rates approaching 100%, with adequate multiple comparisons correction they require 5 times as many subjects than what the typical lab currently utilizes."
This is a fantastic article. The studies you referenced highlighting the flaws with many neural correlate studies provides significant implications for philosophy of mind and the mind-body problem.
ReplyDelete